Drivers of Tropical and Sub-Tropical Heat Extremes
Background and Rationale
Heat extremes have become more intense and frequent in the past 50 years, across almost all tropical and sub-tropical land regions. Even if global warming is limited to 2°C, exposure to dangerous heat stress is projected to increase by 50–100% and, in tropical regions, total outdoor labour capacity is projected to be only 55% of today’s level (Buzan and Huber 2020).
Humid heat poses an even greater threat to health because high humidity reduces the effectiveness of sweating, reducing the body’s ability to thermoregulate. It is essential we adapt to climate change by accurately predicting heat extremes across timescales of hours to years and issuing effective warnings. Unlike for flooding and drought, there is currently no global early warning system for heat.
There are well known global ‘hot spots’ for tropical and sub-tropical humid heat, which include East Asia, Southeast Asia and Northern India (red areas Fig. 1). There are also many coastal regions that experience very intense events such as in the Middle East, west and east coasts of the USA, and East Africa. The land-sea breeze has been shown to play a role in the advection of moisture onto land in the Middle East (Raymond et al. 2020), but these processes are unquantified elsewhere.
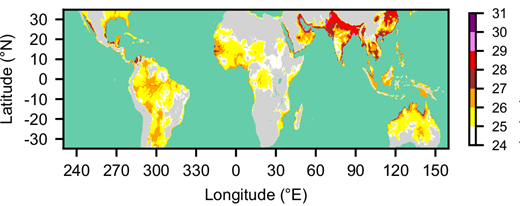
Fig. 1: Humid heatwave intensity, defined at the 95th percentile of daily mean wet bulb temperature (°C) on heatwave days. Grey regions have no events classified as a humid heatwave [taken from Jackson et al. 2025].
Work by the lead PhD supervisor’s research group shows that rainfall variability is a key control on humid heat extremes. In arid or semi-arid areas such as the Sahel region of West Africa, the Middle East and North Australia, humid heatwaves are up to 10x more likely 1 to 3 days after rainfall (blue regions, Fig 2). In more moist areas such as central Africa, East Asia and South America, humid heatwaves are up to 10x more likely 1 to 3 days after a period of low rainfall (red regions, Fig 2). The red and blue regions map closely onto land surface types defined as moisture or energy-limited. Whilst the role of rainfall in humid heat is now understood for the present day, it is necessary to quantify how this relationship might change in the future.
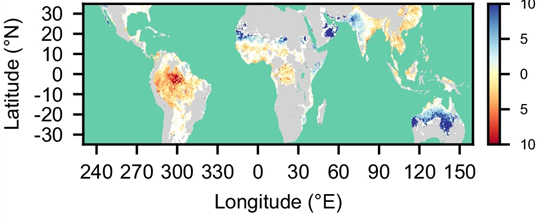
Fig. 2: Relative risk of humid heatwaves occurring on high rainfall days (blue regions) and low rainfall days (red regions) [taken from Jackson et al. 2025].
In the equatorial tropics, kelvin waves have recently been identified as being almost as important as El Nino in increasing the risk of humid heat extremes. Kelvin waves travel west to east along the equator and have a convergent phase (blue in Fig. 3), often associated with cloud and rainfall, and a divergent phase (red in Fig. 3), which is less cloudy. The full cycle of a Kelvin wave takes around 8 days, so it is possible that they drive consecutive (or compound) rainfall/flood and heat extremes. Similar compound extremes may occur elsewhere in the (sub)tropics through different mechanisms.
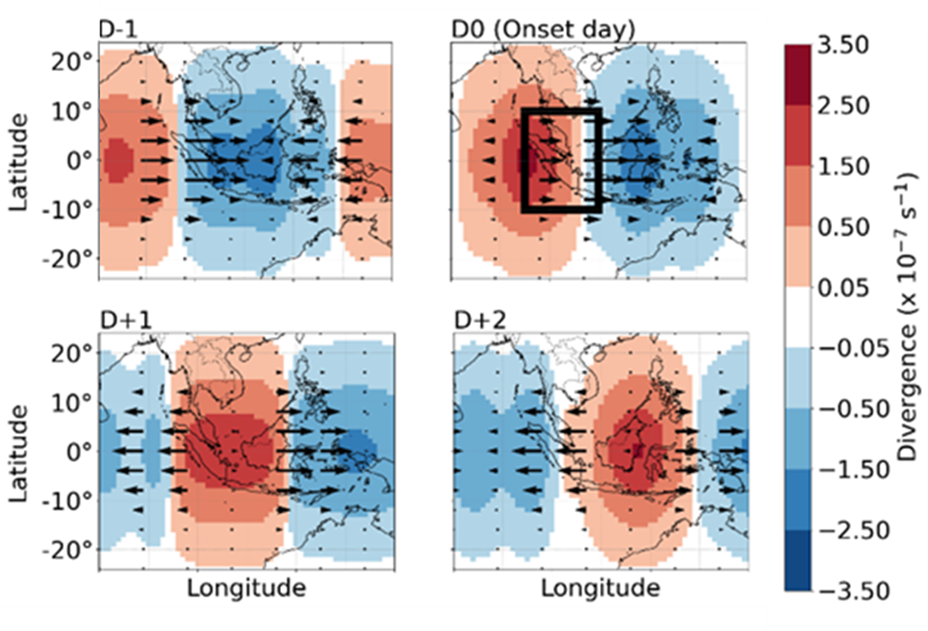
Fig. 3: Low-level (850 hPa) wind (vectors) and divergence (shading) associated with equatorial kelvin waves, composited on the day before (D-1) and during (D0 to D+2) 30 years of humid heat extremes over Indonesia [provided by PhD student Anistia Hidayat].
Project objectives
The project could take several directions, such as:
- Understanding the causes of humid heat through calculation of near-surface temperature and moisture budgets from reanalysis data to quantify the role of advection, subsidence and evaporation in tropical heat extremes. This is both relevant to coastlines via the land-sea breeze and inland via synoptic variability. The methodological starting point is Röthlisberger et al. (2023) and Quinting and Reeder (2017).
- Assessing the co-occurrence of humid heat extremes, intense rainfall and flooding. A starting point would be to look at the role of equatorial Convectively Coupled Kelvin Waves in Southeast Asia. Opposing phases of these waves are known to cause rainfall and hot-humid extremes but how often one follows the other has never been quantified.
- Quantifying the future change in heat drivers using climate models. Previous work has established a link between rainfall, evaporation, solar heating and humid heat (Jackson et al. 2025). Global and regional (convective-scale) climate models will be used to assess the future change in these processes and quantify the future changes.
- Evaluating the ability to skilfully forecast the risk of (sub)tropical humid heat extremes days to weeks in advance, to aid the development of Early Warning Systems.
Training opportunities
You will join a well-established research group, with a recent, strong track record in humid heat research. You will gain skills in data analysis and visualisation using Python, climate modelling and scientific writing. Richard Keane is Met Office staff, based at University of Leeds, and will provide expertise in budget analysis and model data. There is the possibility of the Met Office CASE award, to be applied for once the project has recruited a student.
Key references
Buzan JR and Huber M. 2020. Moist Heat Stress on a Hotter Earth. Annual Reviews, https://doi.org/10.1146/annurev-earth-053018-060100
Chagnaud G, Taylor CM, Jackson LS, Birch CE, Marsham JH, Klein C. 2025. Wet-Bulb Temperature Extremes Locally Amplified by Wet Soils. Geophysical Research Letters, https://agupubs.onlinelibrary.wiley.com/doi/10.1029/2024GL112467
Jackson LS, Birch CE, Chagnaud G, Marsham JH, Taylor CM. 2025. Daily rainfall variability controls humid heatwaves in the global tropics and subtropics. Nature Communications, https://www.nature.com/articles/s41467-025-58694-6
Quinting, J. F., and M. J. Reeder, 2017. Southeastern Australian Heat Waves from a Trajectory Viewpoint. Mon. Wea. Rev., https://doi.org/10.1175/MWR-D-17-0165.1
Raymond C, Matthews T, Horton RM, Fischer EM, Fueglistaler S, Ivanovich C. 2021. On the controlling factors for globally extreme humid heat. Geophysical Research Letters, https://doi.org/10.1029/2021GL096082
Röthlisberger M and Papritz L. 2023. Quantifying the physical processes leading to atmospheric hot extremes at a global scale. Nat. Geosci. https://doi.org/10.1038/s41561-023-01126-1